
AI search visibility metrics answer a question your ranking report cannot: when a buyer asks ChatGPT, Perplexity, or Google's AI Overview about your category, does the answer name you, cite you, and recommend you? This is the KPI set that measures exactly that, each metric with the formula behind it, a worked example, and a plain verdict on whether it is a real signal or a vanity number. It also covers the harder half, tying those metrics to revenue when AI sends almost no referrer data back. Start with the metric that fits the decision in front of you, not the one your tool happens to show first.
Why AI Search Needs Its Own KPIs
Rankings, clicks, and organic sessions describe a world where the answer lives on your page and the user has to visit it. AI search broke that assumption. A buyer can ask ChatGPT for a shortlist, read Google's AI Overview, or compare vendors in Perplexity, and form a decision before any click exists to measure.
That is why traditional analytics under-report AI search. Bain found that about 80% of search users now rely on AI-written summaries for at least 40% of their searches on traditional search engines, and roughly 60% of those searches now end without a click to any site. Your rankings can hold steady while your presence in the answer erodes, and a clicks-only dashboard will show you nothing.
So the metrics have to move up the funnel, to the answer itself. The question is no longer only "where do we rank," but whether an AI engine mentions you, cites your page as its source, recommends you over a rival, and describes you accurately. Those are different events, and they need different AI visibility measures.
Four surfaces carry most of the weight today: ChatGPT, Google AI Overviews, Perplexity, and Gemini, with Claude and Microsoft Copilot close behind. A metric only means something once you say which surface, which prompts, and which time window produced it.
The Three Layers of AI Visibility Metrics
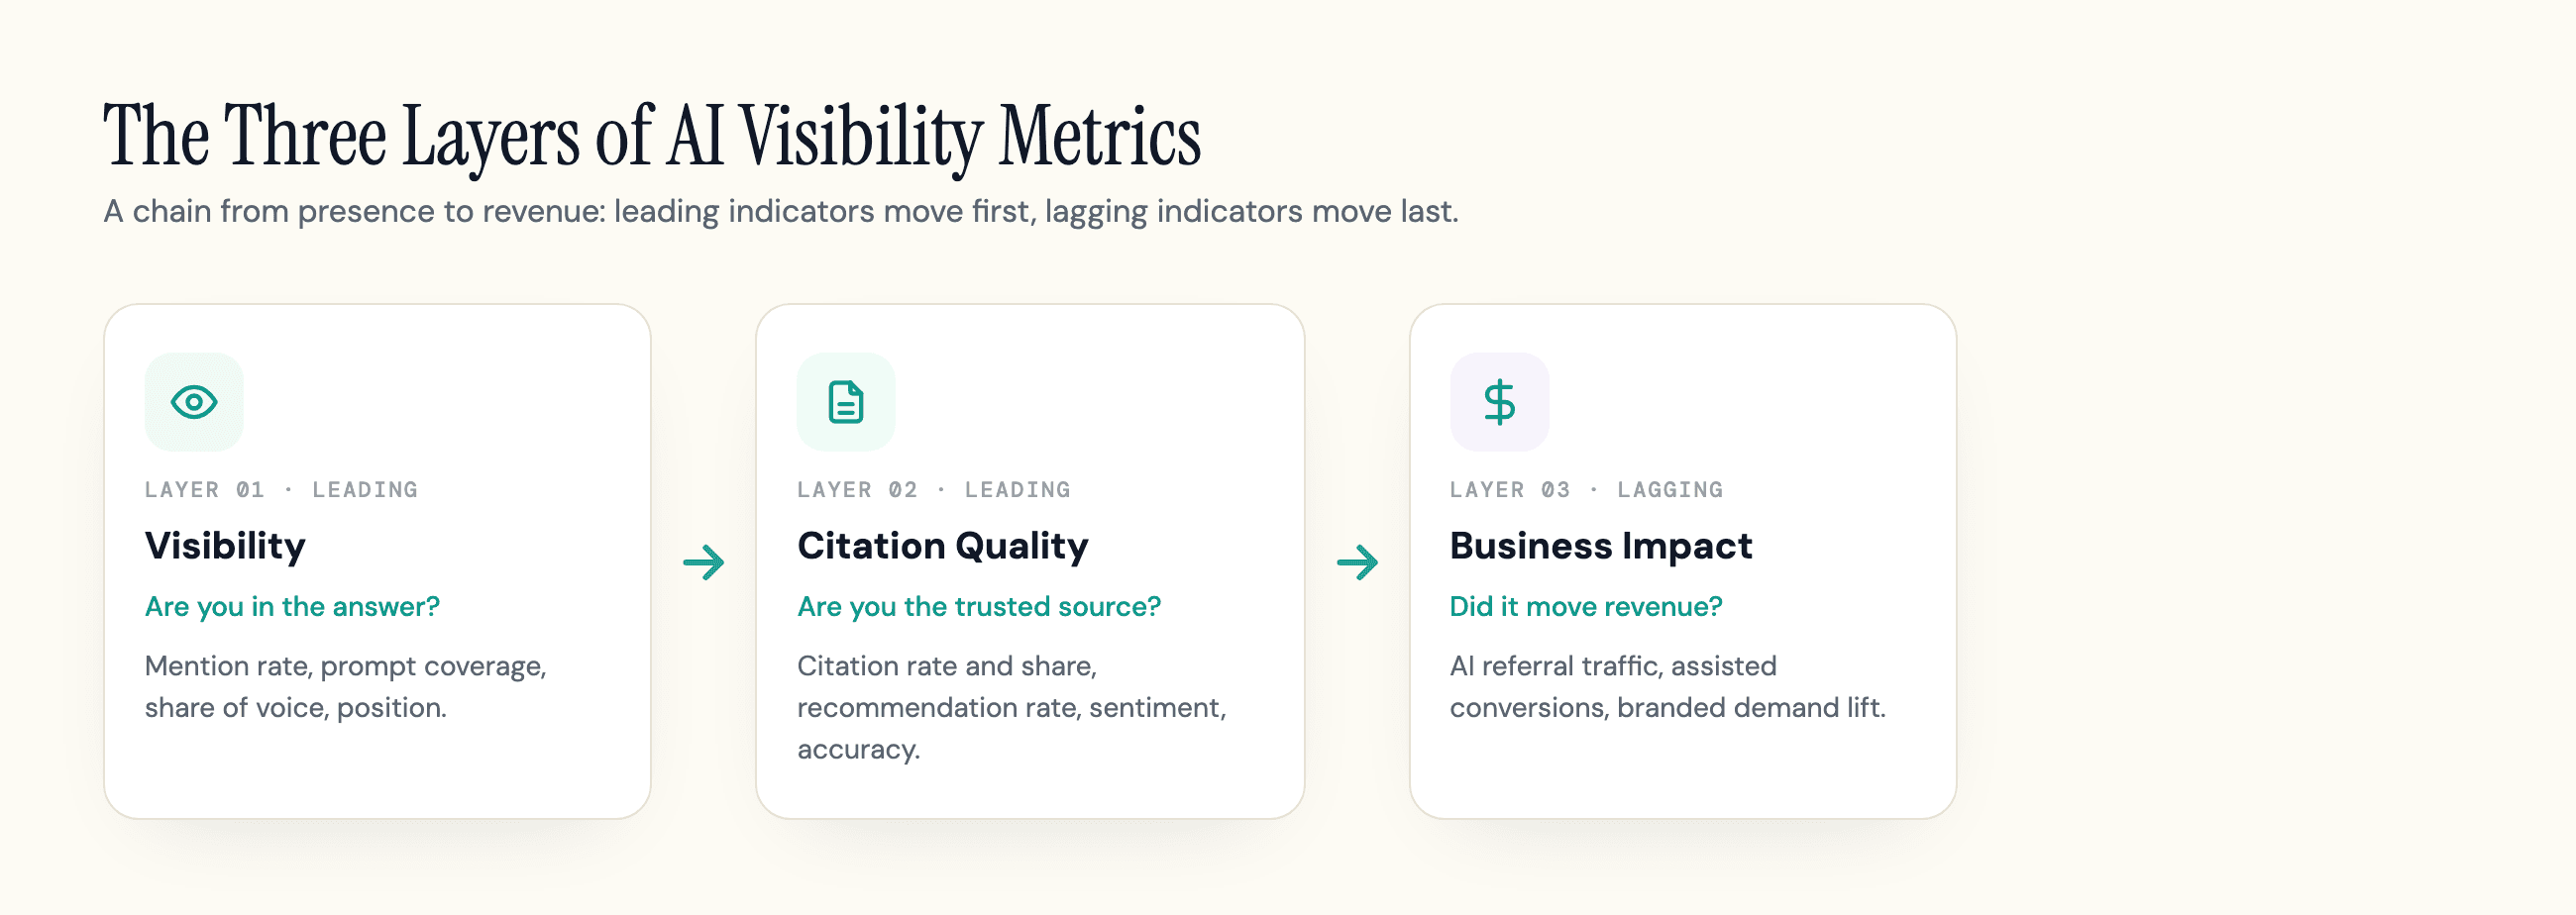
Every metric worth tracking falls into one of three layers, and the layers form a chain. Layer one asks whether you are in the answer at all. Layer two asks whether you are the source the model trusts and how it describes you. Layer three asks whether any of that moved the business.
Read the layers as leading and lagging indicators. Visibility and citation metrics tend to move first, often within days of a content or authority change. Business-impact metrics move last, and only if the first two layers were real. Track a lower layer in isolation and you get a vanity number. Track all three and a sustained rise in coverage should, over the following weeks, tend to show up as branded demand.
The table below is the full set. Each metric carries a formula, a worked example, and a verdict on whether it is a credible signal on its own or only in a pair.
| Metric | Layer | Formula | Worked example | Credible or vanity |
|---|---|---|---|---|
| Mention / inclusion rate | Visibility | (answers naming you ÷ total runs) × 100 | 175 of 500 = 35% | Credible |
| Prompt coverage | Visibility | (prompts with a mention ÷ total tracked prompts) × 100 | 42 of 60 = 70% | Credible |
| Share of voice | Visibility | (your mentions ÷ all brands' mentions) × 100 | 300 of 1,000 = 30% | Credible with a fixed prompt set |
| Position / prominence | Visibility | mean rank in answers where you appear (reported apart from coverage) | mean position 2.3 where you appear | Credible; never treat "not mentioned" as position zero |
| Mention count | Visibility | raw count of brand appearances | 512 mentions | Vanity alone; pair with sentiment |
| Citation rate | Citation quality | (queries citing your domain ÷ total queries) × 100 | 160 of 2,000 = 8% | Credible |
| Citation share | Citation quality | (your citations ÷ all citations in the set) × 100 | 8 of 50 = 16% | Credible |
| Cited-page distribution | Citation quality | share of your citations by page type | 60% guides, 25% product, 15% other | Credible; diagnostic |
| Recommendation rate | Citation quality | (commercial prompts recommending you ÷ relevant runs) × 100 | 18 of 40 = 45% | Credible; revenue-proximal |
| Net sentiment score | Citation quality | ((positive − negative) ÷ total mentions) × 100, range −100 to +100 | (30 − 6) ÷ 40 = +60 | Credible |
| Brand accuracy rate | Citation quality | (accurate claims ÷ claims evaluated) × 100 | 34 of 40 = 85% | Credible; score claims, not whole answers |
| AI referral traffic | Business impact | GA4 sessions from AI referrer hosts | 1,240 sessions / month | Partial; structurally under-counts |
| AI-referred conversion rate | Business impact | (conversions from AI-referred sessions ÷ AI-referred sessions) × 100 | 37 of 1,240 = 3% | Credible where tracked |
| Branded demand lift | Business impact | ((post − pre branded searches) ÷ pre) × 100 | (1,300 − 1,000) ÷ 1,000 = +30% | Directional; heavily confounded |
The next three sections take the layers one at a time.
Layer 1: Are You Even in the Answer?
The base layer measures presence. If the model never names you, nothing downstream can happen, so this is where measurement starts.
Mention rate is the share of answer runs that name your brand. Run a prompt 500 times across your set, get named in 175, and your mention rate is 35%. Do not confuse it with mention count, the raw tally. Count rewards volume and hides quality, which is why a big number next to a flat sentiment or a shrinking share is a vanity signal.
Prompt coverage widens the lens from single prompts to topics. It is the percentage of your tracked prompt library where you appear at all. Coverage of 42 of 60 priority topics tells you the breadth of your presence, and the 18 topics where you are absent are your work list.
Share of voice puts presence in competitive terms: your mentions as a percentage of every brand mentioned in the category. Here a caveat matters more than the formula. Teams define the denominator two ways, either every brand mentioned in the answers, or a fixed set of named competitors, and the two produce different numbers for the same brand. (Do not confuse this with citation share, which counts links rather than mentions.) Worse, both are hostage to the prompt set you chose. Pick flattering prompts and share of voice becomes a self-reinforcing vanity metric. Fix the prompt library first, then the number means something.
Position and prominence capture where you land inside the answer. A brand named first in the summary carries more weight than one buried in a closing list. Track the mean position across the answers where you appear, and report it separately from coverage. The common mistake is treating "not mentioned" as position zero, which silently blends two different failures into one misleading average.
Prominence is also the metric every tool names and none fully solves. Being cited first but dismissed ("cheaper but less reliable") is not the same as being cited third but praised, and no vendor score weights that difference well yet, so read prominence alongside sentiment rather than trusting either alone. A clean way to capture presence is a per-brand mention record: the engine, the prompt, the position, and whether a link came with it.
Layer 2: Are You the Source AI Trusts?
Presence tells you the model knows you exist. This layer tells you whether it trusts your pages and how it talks about you, and it is where quality separates from noise.
Citation rate is the share of queries where the model cites your domain as a source, usually with a link. Cited in 160 of 2,000 tested queries is an 8% citation rate. A citation is a stronger signal than a mention because it means your page was good enough to support the answer, not just recalled from training. Citation share then sets that against rivals: your citations as a percentage of all citations in the query set.
Cited-page distribution is the diagnostic behind the rate. It shows which of your page types actually earn citations, guides versus product pages versus original research. If 60% of your citations land on blog guides and your product pages earn almost none, you know exactly where the content work goes next.
Recommendation rate is the most revenue-proximal metric in this layer. It counts commercial-intent prompts ("best tool for X," "is Y worth it") where the model explicitly recommends you, not just names you. Ten explicit recommendations on purchase-intent prompts are worth more than a hundred passing mentions on informational ones.
Quality is not only about frequency, it is about what the model says. Net sentiment score captures tone as ((positive − negative) ÷ total mentions) × 100, on a scale from −100 to +100. Brand accuracy rate captures correctness, and the method matters: score individual claims, not whole answers. Scoring the whole answer as "half accurate" when it gets your pricing right and your integrations wrong hides which claim failed; a claim-level rate points you at the one specific error to fix, often traceable to a bad third-party page the model is reading, the same pattern our guide to AI brand sentiment walks through.
The discipline that keeps this layer honest is pairing. Read mention count with sentiment, citation frequency with citation share, and presence with prominence, so a single flattering number is always checked against a second that would expose it.
Layer 3: Does It Move the Business?
This is the layer leadership actually cares about, and the hardest to measure cleanly. These are lagging indicators: they move only after visibility and citations have moved, and only if those gains were real.
AI referral traffic is the visible slice: sessions that arrive from an AI surface. GA4 now recognizes most of this on its own. Since May 2026 it ships a native AI Assistant default channel that auto-groups referral sessions from ChatGPT, Gemini, Copilot, Grok, and DeepSeek, with no setup. Two gaps remain, so a complete view still needs a custom channel group: Perplexity is not in the official definition and lands in Referral, and Google's own AI Overviews count as Organic Search rather than as an AI channel. Either way, treat the number as a floor, not a full count, because most AI-influenced visits carry no referrer at all and never reach this channel, for reasons the next section covers.
AI-referred conversion rate connects that traffic to outcomes: conversions from AI-referred sessions over AI-referred sessions. Thirty-seven conversions on 1,240 AI-referred sessions is a 3% rate. It only counts journeys GA4 could attribute to an AI source, so it undercounts the same way the traffic number does, but tracked consistently it shows whether AI referrals behave like your other high-intent channels or better.
Branded demand lift is the metric that catches the invisible majority. Most AI influence never produces a click: a buyer reads a recommendation, remembers the name, and searches for you later. You measure the echo, not the moment. Take branded query clicks and impressions from Search Console before and after a visibility gain and compute ((post − pre) ÷ pre) × 100. A move from 1,000 to 1,300 monthly branded clicks is a 30% lift, allowing for Search Console's own query anonymization.
The catch is confounding. A PR hit, an email campaign, or a paid push can lift branded search at the same time. So branded demand lift is credible as a trend read against annotated events, not as a clean, isolated AI number. Pair it with the two upstream layers and the story holds together. Read it alone and you will credit AI for demand it did not create. For the hands-on setup behind each of these, see our guide to measuring your AI visibility.
The Attribution Problem, and Four Ways Around It
Layer three has a structural flaw worth naming plainly: AI assistants mostly do not pass referrer data, so a large share of AI-influenced sessions land in your analytics as Direct or Organic rather than as an AI referral. The influence happened, the credit did not. This is the gap that makes executives distrust the whole exercise, and it is why, as Search Engine Land argues, revenue evidence beats perfect attribution when you make the budget case.
There is no single fix. There are four methods, and they trade cost against defensibility.
| Method | What it catches | Cost / effort | Defensibility | Best for |
|---|---|---|---|---|
| GA4 referrer channel group | Click-through sessions from AI hosts | Low | Low; under-counts by design | Every team, as a baseline floor |
| Branded-search correlation | The demand echo from unlinked mentions | Low | Medium; confounded by PR, email, paid | Small and mid teams |
| Self-reported attribution | Discovery the clickstream never sees | Low to medium; adds signup friction | Medium; limited by recall bias | Product-led and SaaS signups |
| Incrementality + media mix modeling | The isolated AI contribution to revenue | High; needs data-science resource | High, but only with a proxy exposure | Enterprise and larger budgets |
One caveat sits on the defensible end of that table. Incrementality and media mix modeling assume an exposure you can dial up and down, and organic AI presence has no such switch, so here they lean on quasi-experiments like content-launch timing or matched markets rather than a clean holdout. That makes them the hardest to run on this channel even though they hold up best in a budget review.
The practical answer is not to pick one. Run a cheap continuous method as your always-on read, usually the GA4 channel group plus branded-search correlation, and layer a periodic defensible method on top when a budget decision needs it. A self-reported "How did you hear about us?" field on signup is the highest-value low-effort addition for most SaaS teams, because it captures the exact journeys the clickstream loses.
What none of these buys you is a single, clean "AI revenue" figure. Anyone selling you one is hiding an assumption. Report a range and the method behind it, and the number survives scrutiny.
Making Your Numbers Credible
Every formula above assumes the underlying measurement is stable. It is not. Ask an engine the same question twice and you can get two different answers, even with temperature pinned to zero, a property documented in research on the non-determinism of supposedly deterministic LLM settings. A metric read from a single query is closer to a coin flip than a measurement.
That has three consequences for how you compute these KPIs.
First, sample. Run each prompt several times and aggregate, rather than trusting one response. The GEO measurement literature makes the same point in its title, don't measure once: repetition is what turns a noisy answer into a stable rate. A rough working baseline many teams use is on the order of ten runs per prompt, more for prompts where the answer swings widely, with the stability coming from aggregating across the whole prompt library, not from any single prompt. That rigor has a cost: ten runs across a sixty-prompt library on four engines, every week, runs to thousands of API calls a month, which is why most teams meter it with a tool rather than a homemade script.
Second, respect the margin of error. A 30% mention rate off a handful of runs has a wide confidence band around it, so a jump to 35% next week may be noise, not progress. Treat small movements on small samples as inconclusive, and only act on changes that hold across repeated measurement.
Third, hold the prompt set and the surface constant. Results differ between the API and a logged-in web session, between regions, and between personalized and clean accounts. Change the prompt library or the account and you have changed the instrument, so comparisons over time need a frozen set.
There is one more instrument to pin. Sentiment, accuracy, and recommendation are not counted, they are judged, and the judge is usually another model with the same non-determinism you are trying to measure. Fix that judge to a written rubric, version it, and spot-check a sample against human labels, or those scores will drift for reasons that have nothing to do with your visibility.
Is the Composite "AI Visibility Score" a Vanity Metric?
It can be either. A composite AI visibility score rolls mention rate, citation rate, position, and sentiment into one 0-to-100 number. The problem, as Adweek has argued about why GEO scores are not the answer, is that the weights are proprietary and no two vendors share them, so the same brand scores differently depending on who runs the math. Seer Interactive goes further and calls a standalone score a vanity metric, the way a keyword ranking was.
A score becomes credible under two conditions: the methodology is fixed and disclosed, and you read it as a trend against itself, not as an absolute you compare across tools. As a private, consistent trend line it is useful. As a number you benchmark against a competitor's tool, it is theater.
Before You Track Anything: Can AI Even Reach You?
There is a failure mode that quietly caps the top of this chain. If AI crawlers cannot fetch and render your pages, your live citations and referral traffic collapse and your pages stop being ingested for future answers. Existing mentions can linger for a while, carried by training data and third-party pages that describe you, which is what makes the failure easy to miss: your mention rate still looks alive while citations and traffic fall to zero, and no dashboard tells you the cause is a blocked bot rather than weak content.
So reachability is the precondition, not a footnote. Before you trust a single number, confirm that GPTBot, ClaudeBot, PerplexityBot, and Google's AI crawlers can actually reach the pages you want cited, and that those pages expose clean, parseable content and schema rather than JavaScript the crawler never runs. The sites we run through our AI crawler checker fail this test more often than their owners expect, and the culprit is usually a robots.txt rule written years ago for a different bot, not anything about the content itself.
Crawl frequency is itself an operational signal worth logging. A rising trend of GPTBot and ClaudeBot hits in your server logs means those crawlers are fetching your new content, which is a precondition for being cited, not proof of it. It is still the earliest thing you can watch: fetching has to happen before any citation can, so a flat or falling crawl trend is an early warning even when your other metrics have not moved yet. Run the reachability check first, then a full AI visibility audit to confirm the AI crawlers can read what matters. Only once retrieval is clean does a low metric mean what you think it means, a content and authority gap you can close.
Your Executive Scorecard: The Core KPIs That Matter
Most tools will hand you fifteen or twenty metrics. Reporting all of them is how a dashboard becomes noise nobody reads. The set below is enough to run a program and defend a budget, one or two metrics per layer, each paired so no single number can mislead. To see where these KPIs sit in a full monthly client report, our SEO report template puts an AI visibility section next to the classic ones. If you send these metrics to clients under your own brand, see our white-label reporting tools compared.
| KPI | Layer | Leading or lagging | Business signal it maps to | Cadence |
|---|---|---|---|---|
| Prompt coverage | Visibility | Leading | Breadth of presence across topics | Weekly |
| Share of voice | Visibility | Leading | Competitive standing | Weekly |
| Citation share | Citation quality | Leading | Source trust versus rivals | Weekly |
| Recommendation rate | Citation quality | Leading | Influence on purchase-intent prompts | Biweekly |
| Net sentiment score | Citation quality | Leading | Reputation risk and accuracy | Biweekly |
| AI referral + referred conversions | Business impact | Lagging | Traffic and pipeline | Monthly |
| Branded demand lift | Business impact | Lagging | Downstream demand echo | Monthly to quarterly |
Segment the leading metrics by engine and by prompt category, because a rise in ChatGPT can mask a fall in Perplexity, and coverage on informational prompts tells a different story than coverage on commercial ones. Keep the lagging metrics whole; they are too coarse to slice usefully. Read the weekly cadence as monitoring, not a trigger. For the sampling reasons above, act on multi-week trends, not single-week movements, which on realistic samples are usually noise.
That is the scorecard we build toward when we track a site's AI presence at geotoolbox, and it is deliberately smaller than what most tools display. If you are still choosing where to run the measurement, our comparison of the best AI visibility tools covers which platforms track which engines and at what cost per prompt.
Frequently Asked Questions
How do you measure AI search visibility?
You run a fixed set of prompts through the AI engines that matter to you, repeat each prompt several times to average out non-determinism, and record whether your brand is mentioned, cited, recommended, and how it is described. Those raw events become rates: mention rate, citation rate, share of voice, and sentiment. Downstream, you add business metrics like AI referral traffic and branded demand lift to connect visibility to outcomes.
Can you track AI referral traffic in GA4?
Partly, and more easily than a year ago. Since May 2026 GA4 has a native AI Assistant channel that automatically captures referral sessions from ChatGPT, Gemini, Copilot, Grok, and DeepSeek, though Perplexity still shows as Referral and Google's AI Overviews count as Organic. What GA4 cannot see is the large share of AI-influenced journeys that arrive with no referrer and land in Direct. Use the AI Assistant number as a floor and pair it with branded-search correlation or a self-reported signup question to recover the traffic the clickstream loses.
How many prompts do you need to track for reliable metrics?
Two dimensions matter: how many distinct prompts, and how many times you run each. A representative prompt library that spans your priority topics and buying stages matters more than a huge one, and each prompt should be run several times, on the order of ten, so the rate is stable rather than a single noisy draw. Freeze that library so comparisons over time stay valid.
What is the difference between mention rate and share of voice?
Mention rate is absolute: the percentage of answer runs that name you. Share of voice is relative: your mentions as a percentage of every brand mentioned in the category. You can hold a high mention rate while your share of voice falls because competitors are being named more often, which is why the two belong on the scorecard together.
Where to Start
Do not stand up a twenty-metric dashboard. Pick one or two KPIs per layer from the scorecard above, freeze a representative prompt set, run each prompt enough times to trust the rate, and read the metrics in pairs. That set is enough to see whether your presence is growing, whether your citations are credible, and whether either is moving branded demand.
But confirm reachability before you trust any of it. If AI crawlers cannot read your pages, your citations and referral traffic fall to zero for a reason no metric will explain, and new content never enters the answers at all. You can check whether AI crawlers can reach your site free in a couple of minutes, which is the fastest way to rule out the failure that makes measurement meaningless. Fix retrieval first, then measure, and geotoolbox is built to handle both halves, the crawl-level diagnostics and the ongoing visibility tracking, in one place.
Sources
- Consumer reliance on AI search results signals new era of marketing - Bain & Company, 2025 -
bain.com/about/media-center/press-releases/20252/consumer-reliance-on-ai-search-results-signals-new-era-of-marketing--bain--company-about-80-of-search-users-rely-on-ai-summaries-at-least-40-of-the-time-on-traditional-search-engines-about-60-of-searches-now-end-without-the-user-progressing-to-a - How to justify GEO investment without perfect attribution - Search Engine Land, 2026 -
searchengineland.com/geo-investment-attribution-482108 - AI Visibility is a Vanity Metric, here's how to tell your boss - Seer Interactive, 2026 -
seerinteractive.com/insights/ai-visibility-is-a-vanity-metric-prepare-your-execs - Why GEO scores aren't the solution to your brand's AI engine visibility - Adweek, 2026 -
adweek.com/media/why-geo-scores-arent-the-solution-to-your-brands-ai-engine-visibility - Don't Measure Once: Measuring Visibility in AI Search (GEO) - Schulte et al., arXiv, 2026 -
arxiv.org/abs/2604.07585 - Non-Determinism of "Deterministic" LLM Settings - Atil et al., arXiv, 2024 -
arxiv.org/abs/2408.04667 - [GA4] Default channel group, native AI Assistant channel added May 2026 - Google Analytics Help -
support.google.com/analytics/answer/9756891