
A good SEO report template saves you from rebuilding the same report every month and tells the reader what to do next. This report template has ten sections, a one-page executive cut, and a spreadsheet you can download and fill in today.
In our read of the readable top results for "seo report template" on 2026-09-30, only one treats AI visibility as a reporting metric, and one more covers AI referral traffic. This one adds a section on reporting AI visibility without claiming more than the data shows. Disclosure: geotoolbox publishes this template and sells a paid AI visibility tracker.
What a Monthly SEO Report Should Do
A monthly SEO report has three jobs: show results tied to business outcomes, explain what changed and why, and decide what happens next. An SEO report is a regular summary of how a site performs in organic search (and now in AI search), written for the person who has to decide whether the work continues.
The second job is the easiest to skip. The numbers went up or down, the report says which, and it stops there. It does not say why, what it means for leads, or what you will do about it.
The fix is structural. Put the answer first (result, cause, next step), keep the evidence one layer down, and cut every number that would not change a decision. One report then serves both the stakeholder who owns revenue and the marketing lead who wants the pages and queries behind the movement.
Deck, Dashboard, or Spreadsheet: Pick the Format First
Choose the format by who reads the report and how much monthly effort you can afford. Each format fails in a different place.
| Format | Best when | Breaks when | Monthly effort |
|---|---|---|---|
| Slide deck or PDF | A client or executive needs a curated story with your commentary on every chart | The numbers change weekly and you rebuild slides by hand | Highest, because every number is copied in |
| Live dashboard (Looker Studio or a reporting tool) | Your own team checks numbers often and the data sources are stable | A connector loses access, or nobody writes the commentary and the client reads a data export | Low after a setup that takes real work |
| Spreadsheet template (the report template below) | You want a report that works this week, with no connectors, that you fully control | You report for dozens of clients and copy-paste becomes the job | Medium |
Google's own guide on using Search Console and Google Analytics data ships a Looker Studio dashboard template that puts Search Console and Google Analytics 4 (GA4) side by side, so a dashboard is a fair choice when the data sources are stable and someone owns the commentary. A spreadsheet wins on control: it works when a connector breaks.
Whatever you pick, tier it: a one-page executive summary, the monthly report, and an appendix with the raw tables.
The 10-Section Monthly SEO Report Template
Ten sections cover a monthly SEO report, and four of them make the one-page executive version. The order matters. It runs from the verdict (section 1) through the evidence (2 to 8) and the AI layer (9) to the decision (10).
| # | Section | Question it answers | Source | Rule |
|---|---|---|---|---|
| 1 | Executive summary | What happened, why, and what next? | Sections 2 to 9 | Result, cause and next step in a few short sentences. Write it last, place it first. |
| 2 | KPI scorecard | Are we on track? | GA4, Search Console, rank tracker | 5 to 8 KPIs with month-over-month change, year-over-year change, a target and a status. |
| 3 | Organic traffic and conversions | Is search producing business results? | GA4 | Organic sessions, key events, key-event rate. Lead with conversions. |
| 4 | Search Console: brand vs non-brand | Is growth new demand or existing fans? | Search Console | Split clicks by your brand terms and report non-branded clicks on their own. |
| 5 | Rankings, winners and losers | Which terms moved? | Rank tracker | Track a fixed keyword set. Count top 3 and top 10, list the biggest movers. |
| 6 | Landing pages and content | Which pages drove the results? | GA4, Search Console | Top 10 pages, one line each on what changed. |
| 7 | Technical exceptions | What is broken right now? | Site audit, Search Console | Issue, affected URLs, severity, status. Exceptions only. |
| 8 | Backlinks | Is authority growing? | Backlink tool | New referring domains and the links that matter. Report third-party authority scores as a direction. |
| 9 | AI visibility | Are we showing up in AI answers? | Search Console, Bing, GA4, prompt panel | Three layers, reported separately, with the method stated. |
| 10 | Next steps | What happens next? | Your plan | Owner, expected effect, and the one decision you need. |
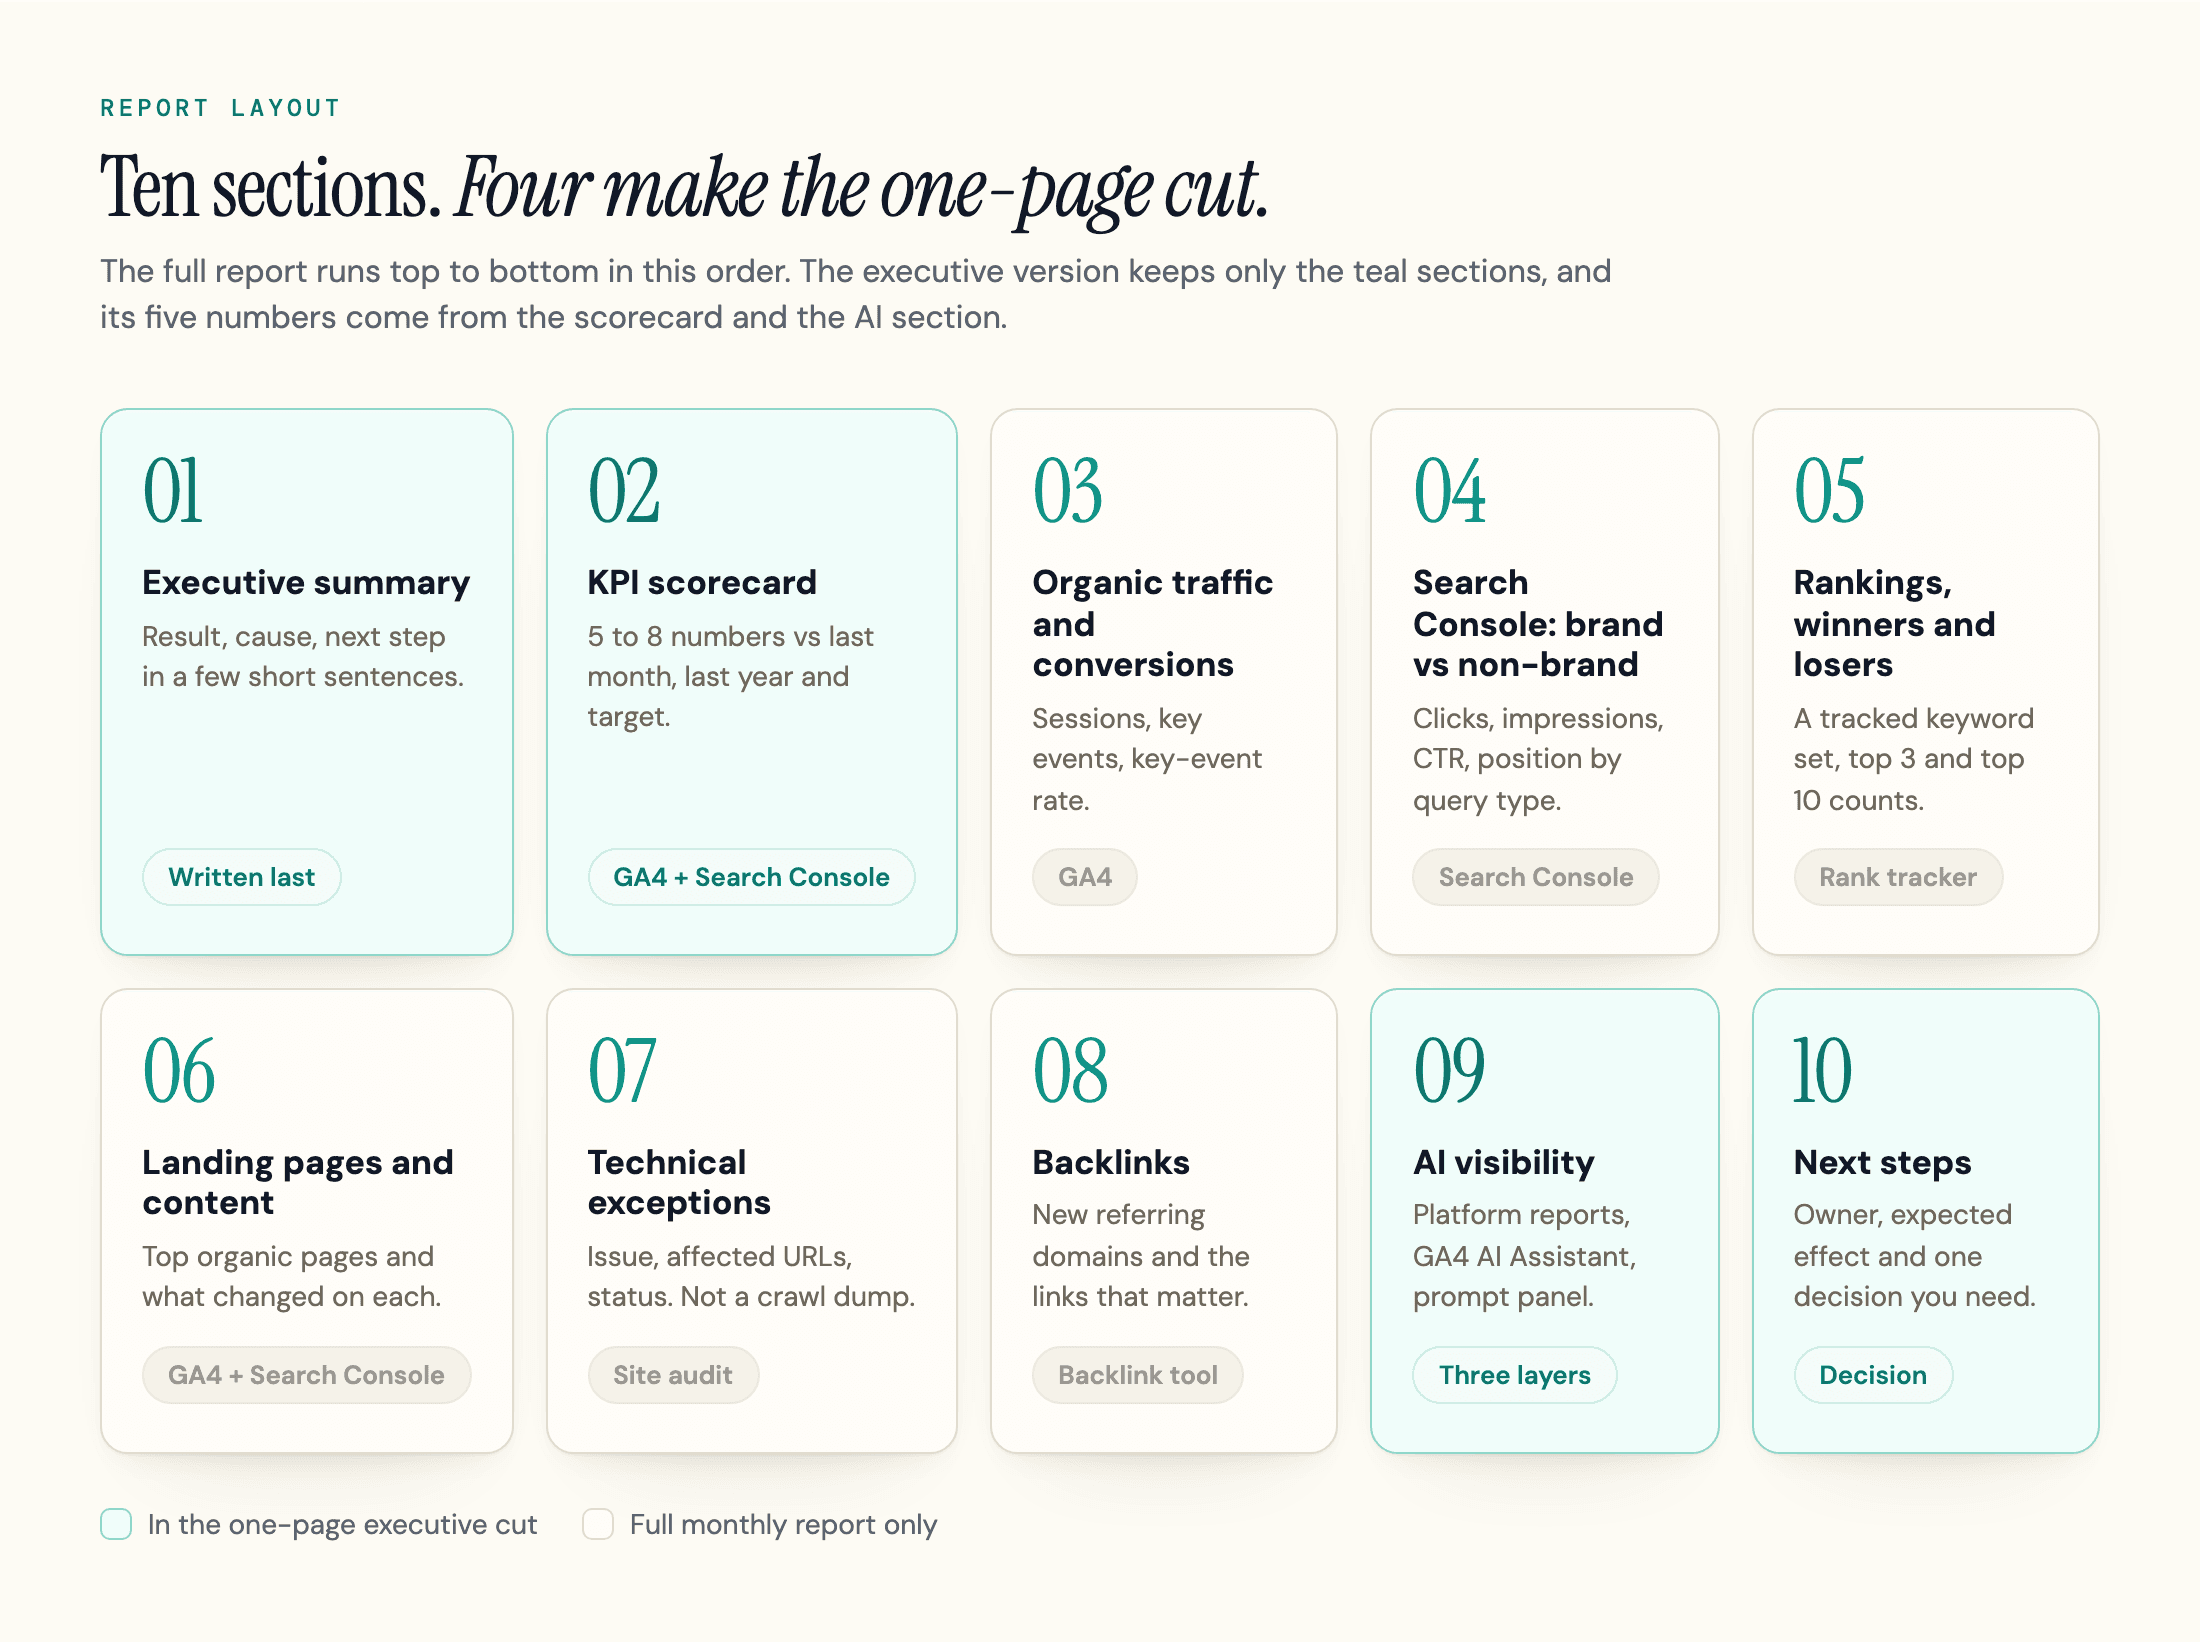
Every section answers one question. If you cannot name the question, cut the section.
Download the Spreadsheet Template
We built the template as a spreadsheet with seven working tabs plus a Start Here tab, and filled it with example numbers, so it doubles as a sample SEO report you can study before you paste in your own data. Download the SEO monthly report template (XLSX), then open it in Excel or upload it to Google Sheets. Yellow cells are inputs, grey cells hold example values to overwrite (including the inputs on Start Here), and green cells are formulas.
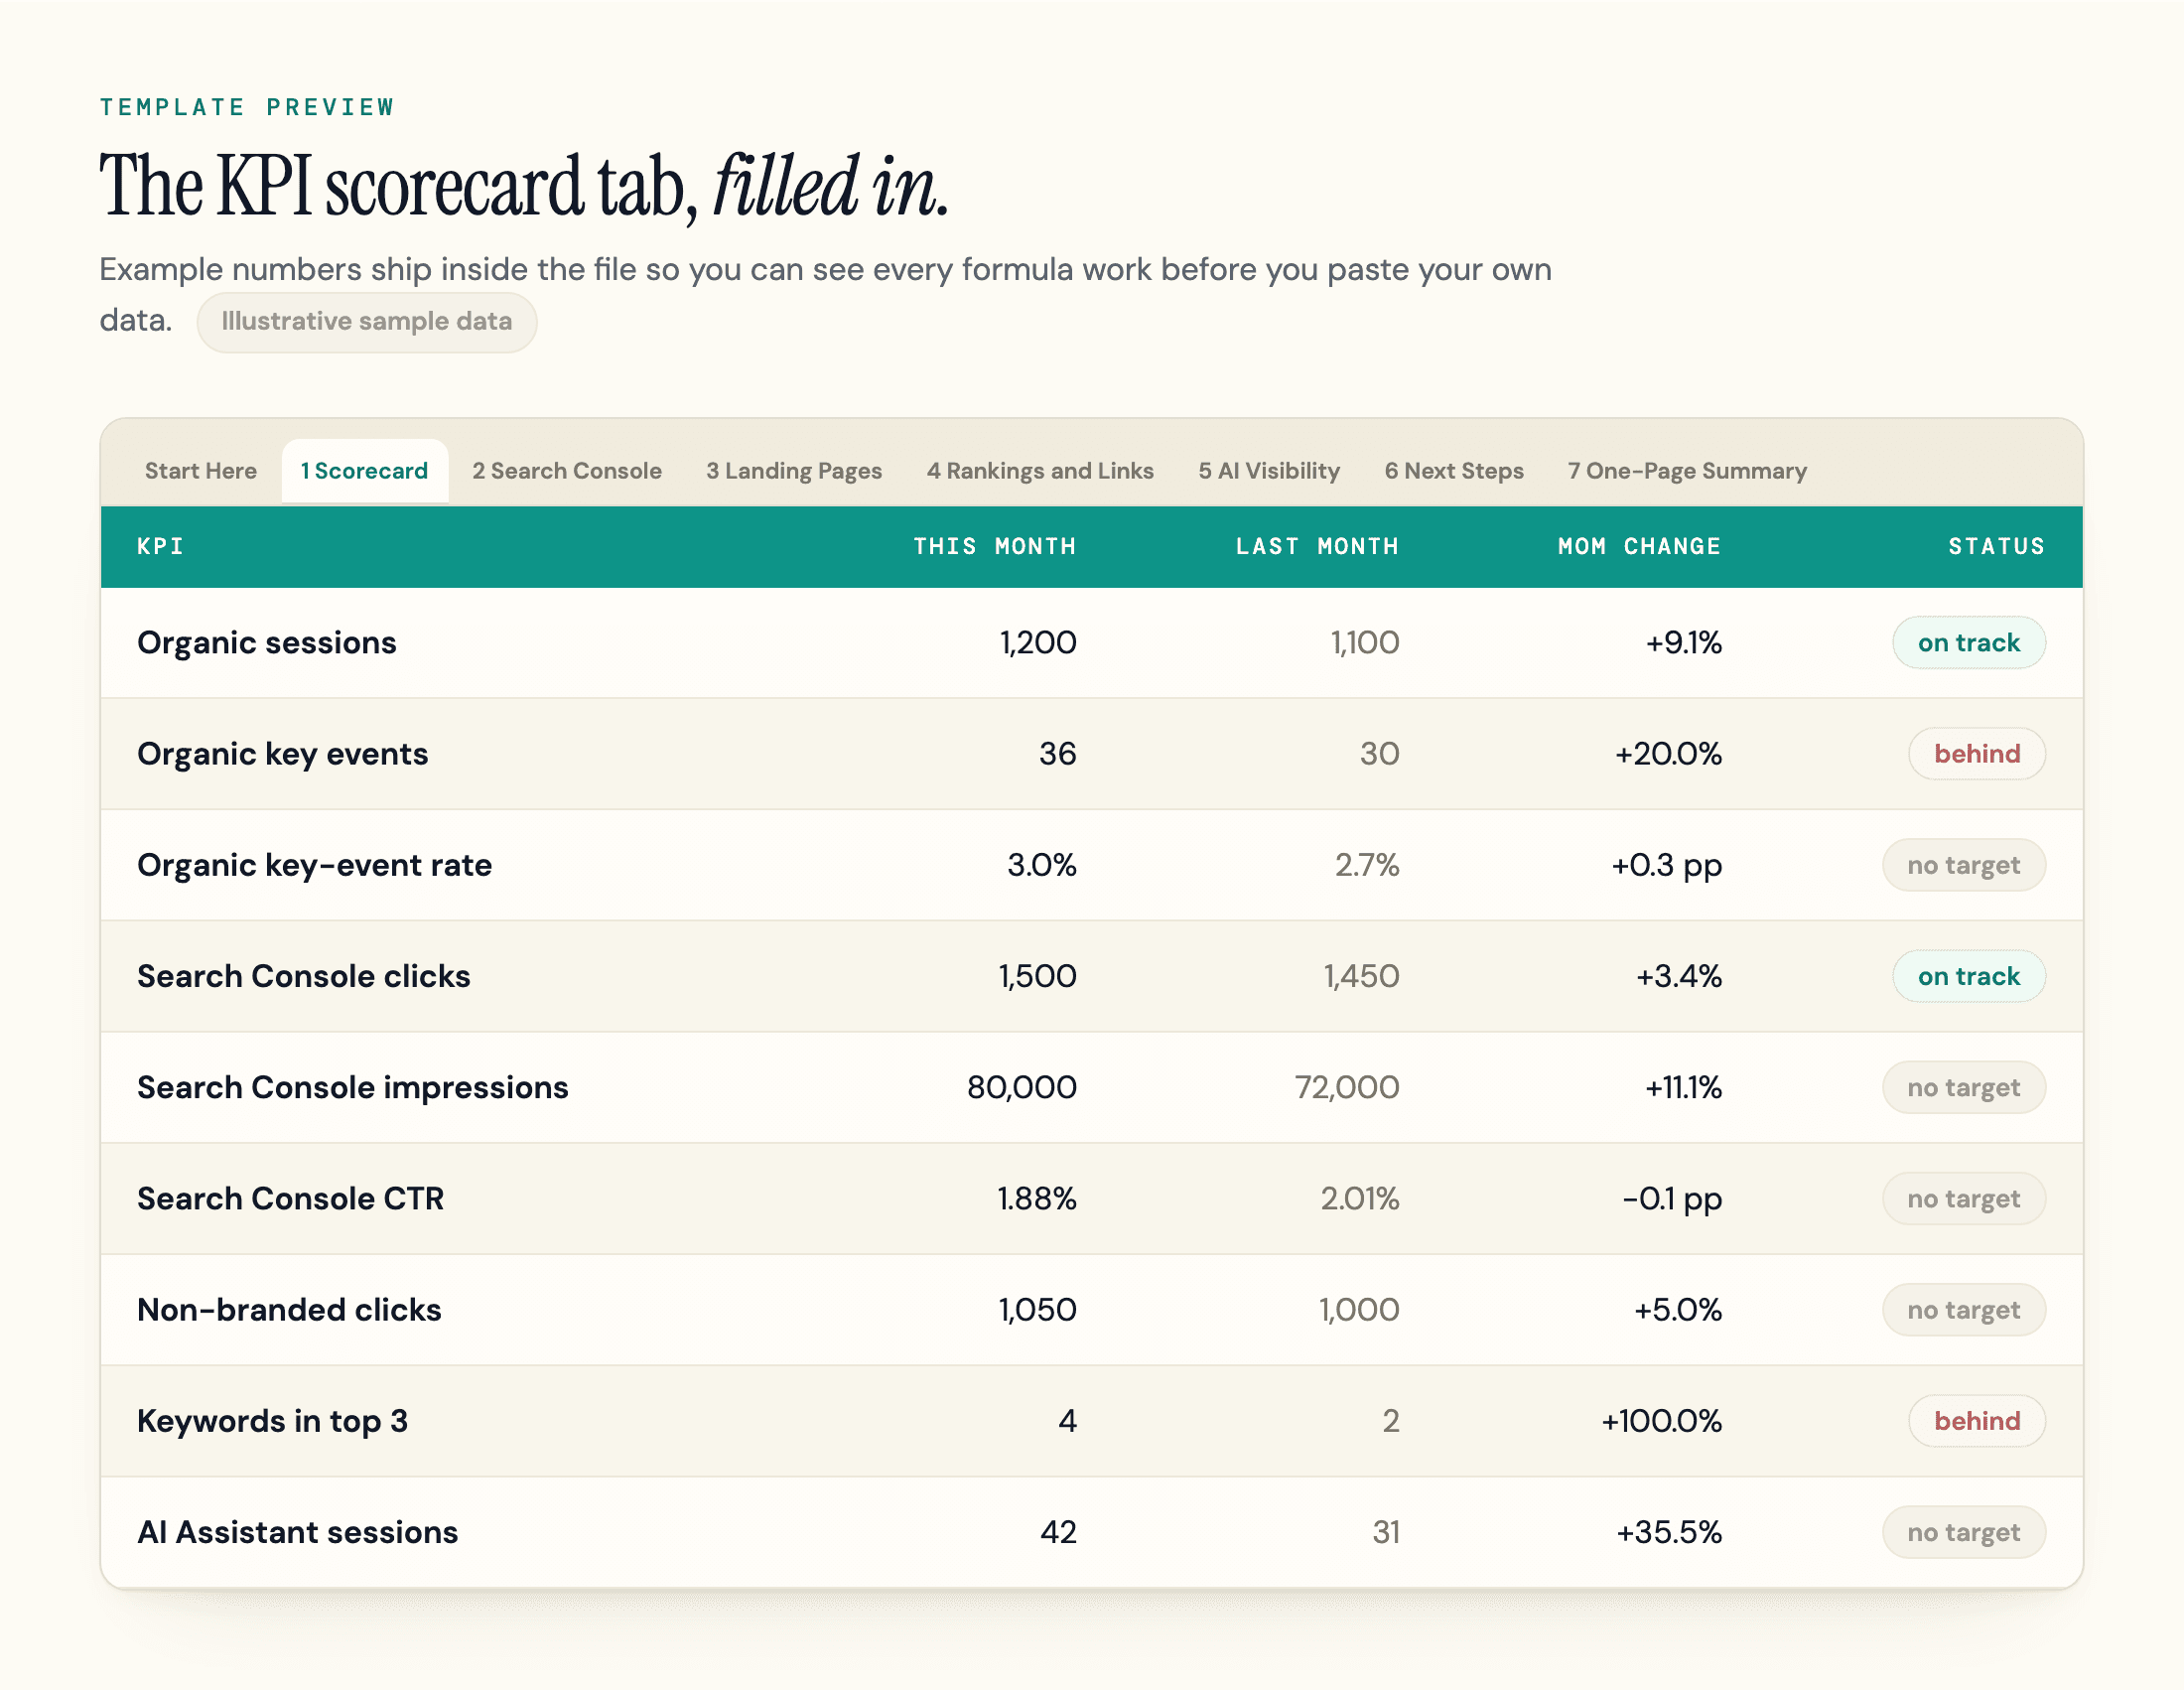
The tabs map to the ten sections like this:
| Tab | Covers | What it does |
|---|---|---|
| Start Here | All sections | Brand terms, the GA4 key events that count and the date range (set once), plus the two month cells you change every month |
| 1 Scorecard | Sections 2 and 3 | KPIs with month-over-month and year-over-year change, a target and a status |
| 2 Search Console | Section 4 | Labels your top queries as branded or non-branded, totals the clicks, and flags non-branded queries at positions 4 to 5 and 11 to 15 and queries with a low CTR for their position |
| 3 Landing Pages | Section 6 | Top pages with sessions, key events, clicks, a line on what changed, and a flag on pages whose clicks fell by more than a set share (20% by default) |
| 4 Rankings and Links | Sections 5, 7 and 8 | A tracked keyword set with top 3 and top 10 counts, technical exceptions, and new referring domains |
| 5 AI Visibility | Section 9 | Platform reports, the GA4 channel, and a prompt-panel log with mention, citation and recommendation rates |
| 6 Next Steps | Section 10 | What shipped, what ships, owner, expected effect, status |
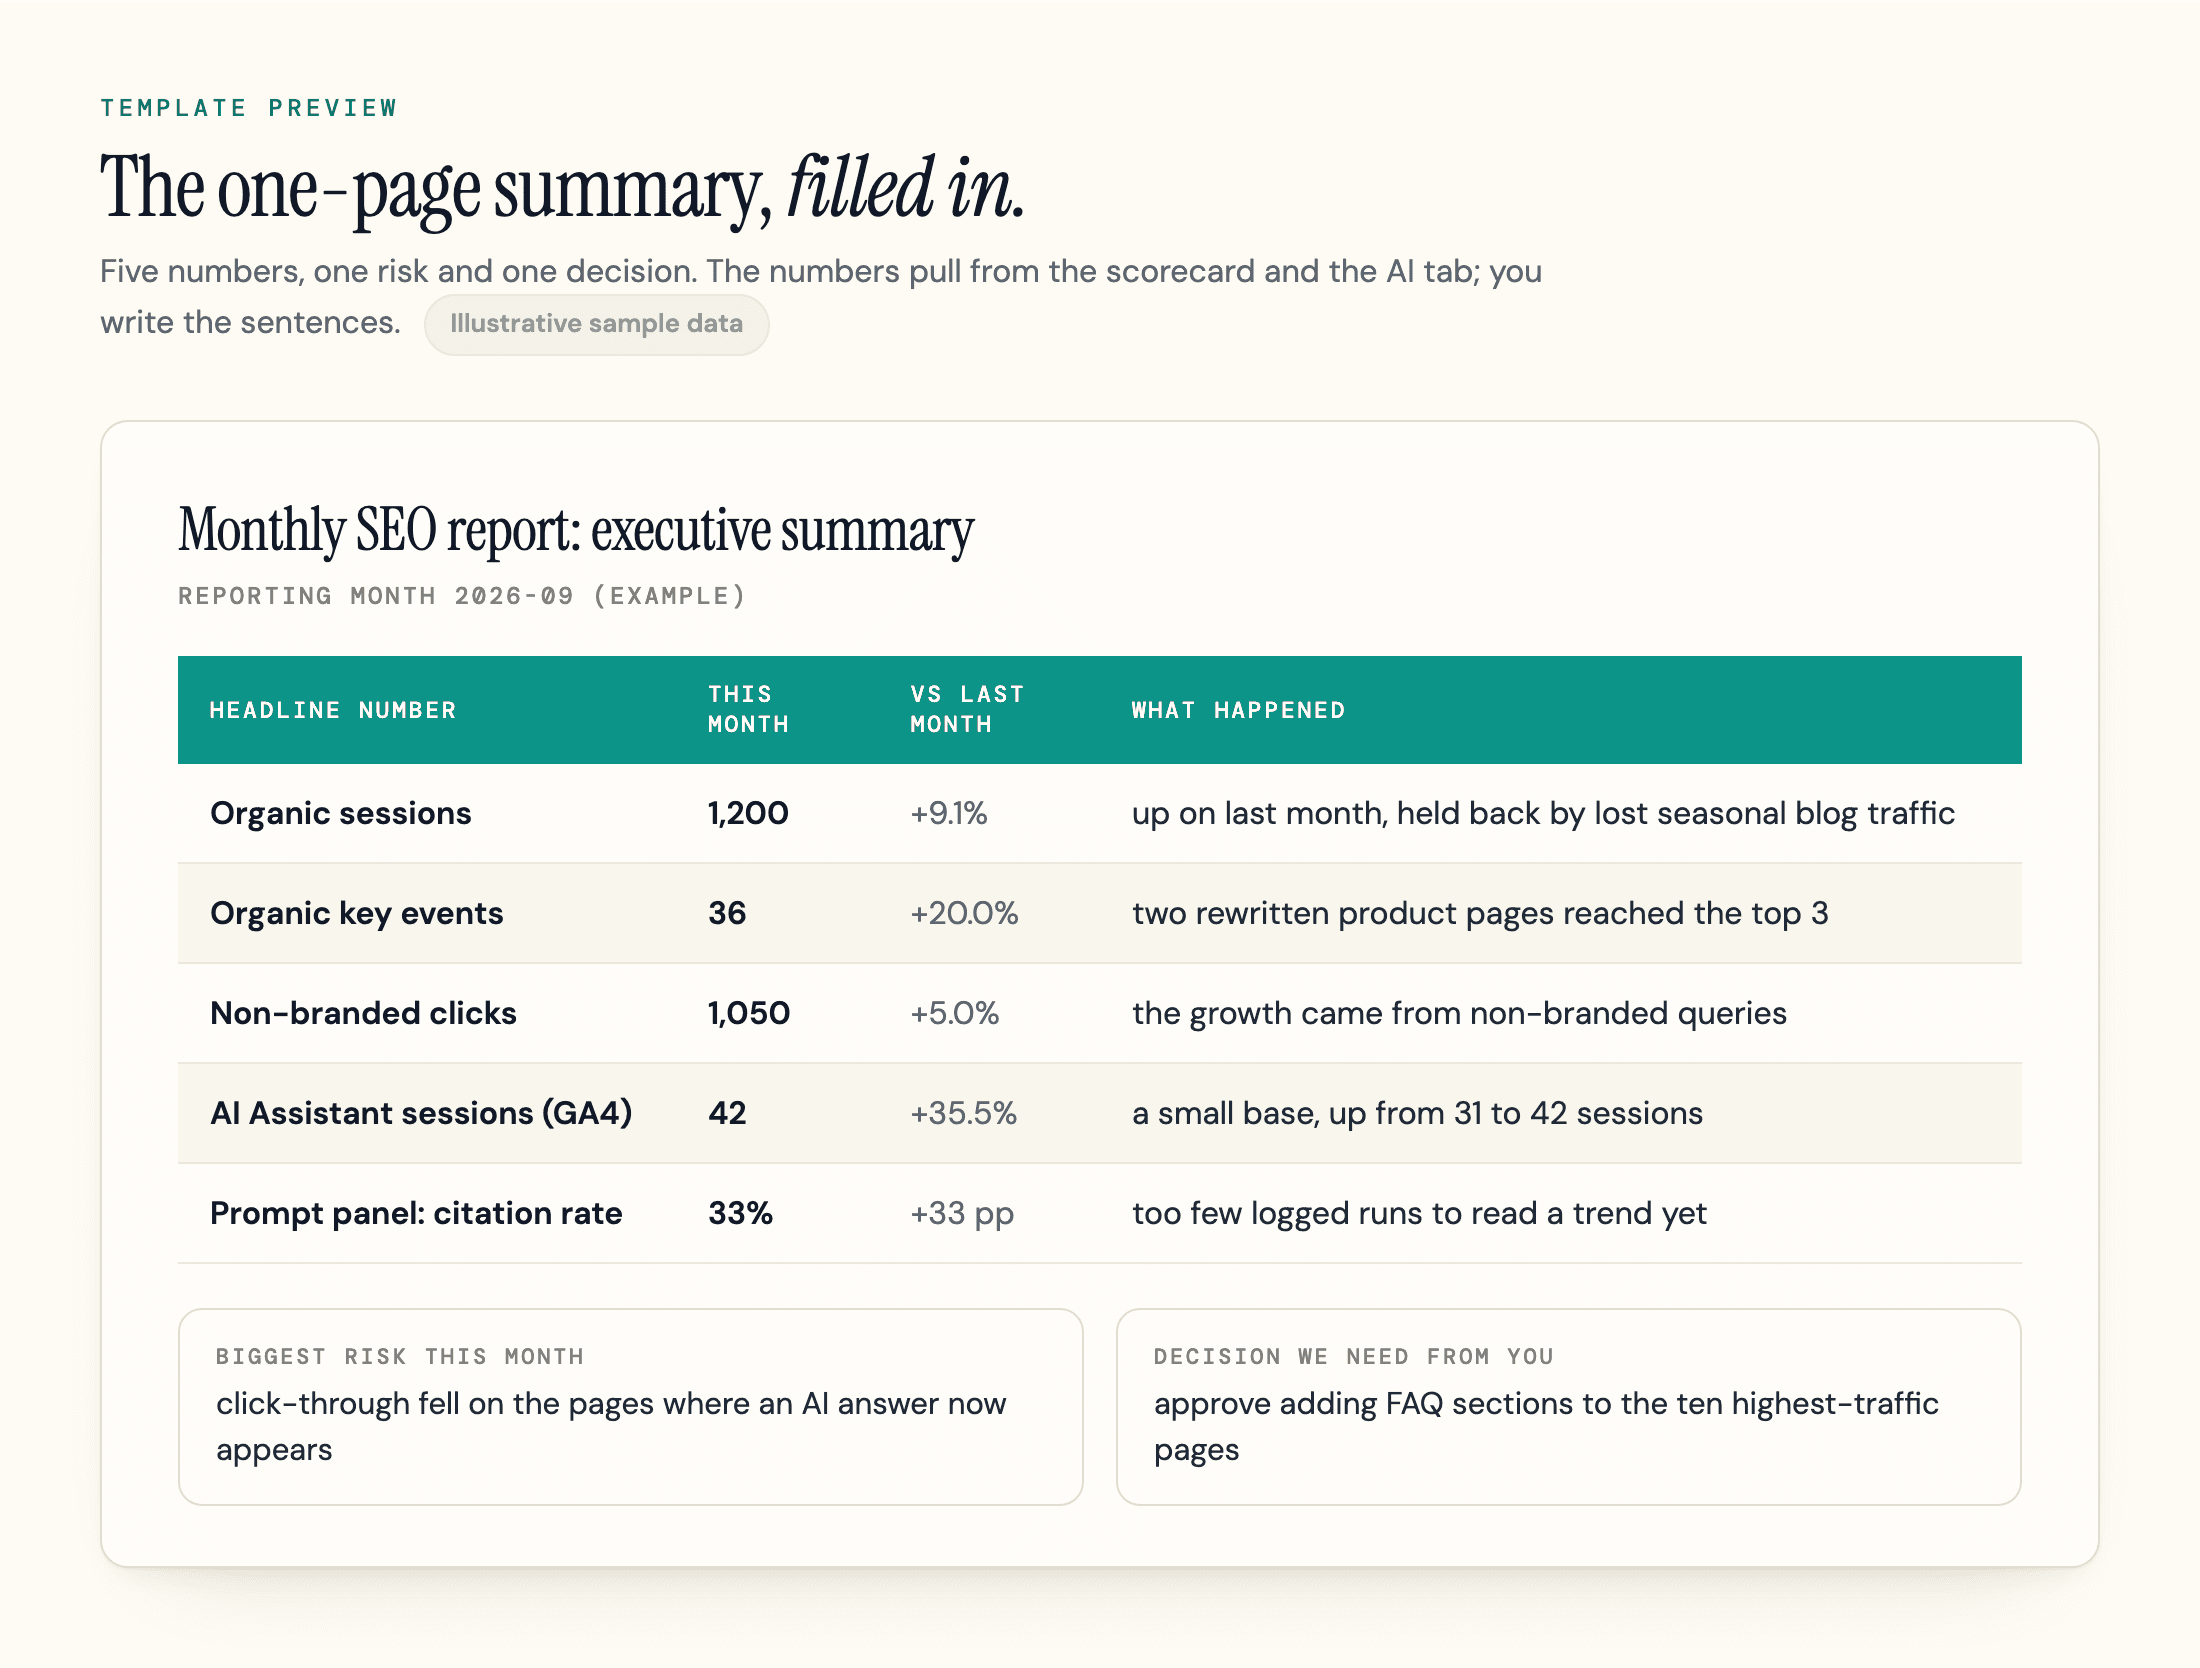
| 7 One-Page Summary | Section 1 | The executive version, pulling five numbers from the scorecard and the AI tab |
Clear rows you do not use instead of deleting them, because other tabs read those rows. The brand-term check on tab 2 is a plain text match, so it works in Excel and Google Sheets, and formulas calculate when the file opens (some file previewers show blank cells). If you would rather build a Looker Studio SEO report template, keep the same definitions and use tab 1 as the first page.
How to Build Each Section
Build the sections in data order, then write the summary last. The spreadsheet follows the same order, so you can fill it in as you read.
Executive Summary
A few short sentences: what happened, why, and what you will do next. Name one number, one cause and one action, then stop. An example of the shape:
Organic key events rose from 30 to 36 month over month, driven by two rewritten product pages that moved into the top 3. Sessions grew more slowly because the blog lost seasonal traffic. Next month we add FAQ sections to the ten highest-traffic pages, which should lift non-branded clicks.
Tie the headline to leads or revenue whenever you can. A reader who sees "traffic is up" learns nothing about whether the work pays.
KPI Scorecard
Pick five to eight KPIs and keep them the same every month. For each, show this month, last month, the same month last year, a target, and a status. Year-over-year matters because search demand is seasonal, and a month-over-month dip in December says little. The spreadsheet's scorecard tab lists more candidate rows than you need, so clear the ones you will not stand behind every month.
| KPI | Source | Watch out for |
|---|---|---|
| Organic sessions | GA4, Organic Search channel | Sessions can fall while conversions rise, so never show them alone |
| Organic key events | GA4 | Keep the event list stable across months, or the trend breaks |
| Search Console clicks, impressions and click-through rate (CTR) | Search Console | Report clicks and impressions together, because one moving without the other is the diagnosis (see the bad-month table below) |
| Non-branded clicks | Search Console | Take the total from a query filter that excludes your brand terms |
| Keywords in the top 3 | Rank tracker | Only meaningful for a fixed tracked set |
| Organic revenue or pipeline value | GA4 or your CRM | Report it only when you can say how it was attributed |
Organic Traffic and Conversions
Start from the Organic Search channel in Google Analytics. Report organic sessions, organic key events, and the key-event rate, calculated as key events divided by sessions. It counts repeat key events inside one session, so keep the definition the same every month. Which events count as key events is yours to decide.
Search Console: Brand vs Non-Brand
Report non-branded clicks on their own, because branded clicks come from people who already know you. They rise with PR and word of mouth, so a blended number can look like SEO growth when search found nobody new.
Filter the Performance report's queries to exclude your brand terms, including misspellings and product names, and review that list every quarter. Tab 2 of the spreadsheet does the split for your top queries: type your brand terms once on the Start Here tab and it labels every query. It also marks non-branded queries with at least 50 impressions that sit at positions 4 to 5 or 11 to 15 as the next candidates for work, and those whose CTR is under half the expected CTR for their position. Both thresholds are settings on the tab. The expected-CTR column holds starting values, so replace them with your own site's curve, and treat a low-CTR flag as a prompt to check the title or an answer box.
Be careful with average position. Google defines the position value as the topmost position your property held for each query, averaged across every query where it appeared.
So when a new batch of long-tail queries starts showing you on page two, the average gets worse while clicks hold or rise. Google adds that the figure differs from what any one searcher saw, because of location and search history. Report position by query group or page.
Rankings, Winners and Losers
Track a fixed keyword set, one you chose on purpose and change rarely. Report how many sit in the top 3 and top 10, and name the biggest gainers and losers with a one-line reason each. Note any month a new SERP feature appeared on a tracked term.
A rank tracker checks chosen keywords from a location you set, while Search Console averages real impressions, so show them side by side and never swap one for the other. If the client asks how they compare with rivals, add a rank-overlap view against a few named competitors for the terms that matter commercially. Tab 4 of the spreadsheet holds the keyword set with its top 3 and top 10 counts.
Landing Pages, Technical Exceptions, and Backlinks
For each of these, report less than your tools can export:
| Area | Report this | Leave in the appendix |
|---|---|---|
| Landing pages and content | The ten pages with the most organic sessions, one line each: new, updated, moved up, moved down, or seasonal | Every URL with its metrics |
| Technical health | Exceptions: the issue, the URLs affected, severity and status, plus indexing changes since last month and any pages failing Core Web Vitals | The full crawl export |
| Backlinks | New referring domains and the few links that matter, such as an industry publication or a partner | The complete link list |
Add an AI Visibility Section to the Report
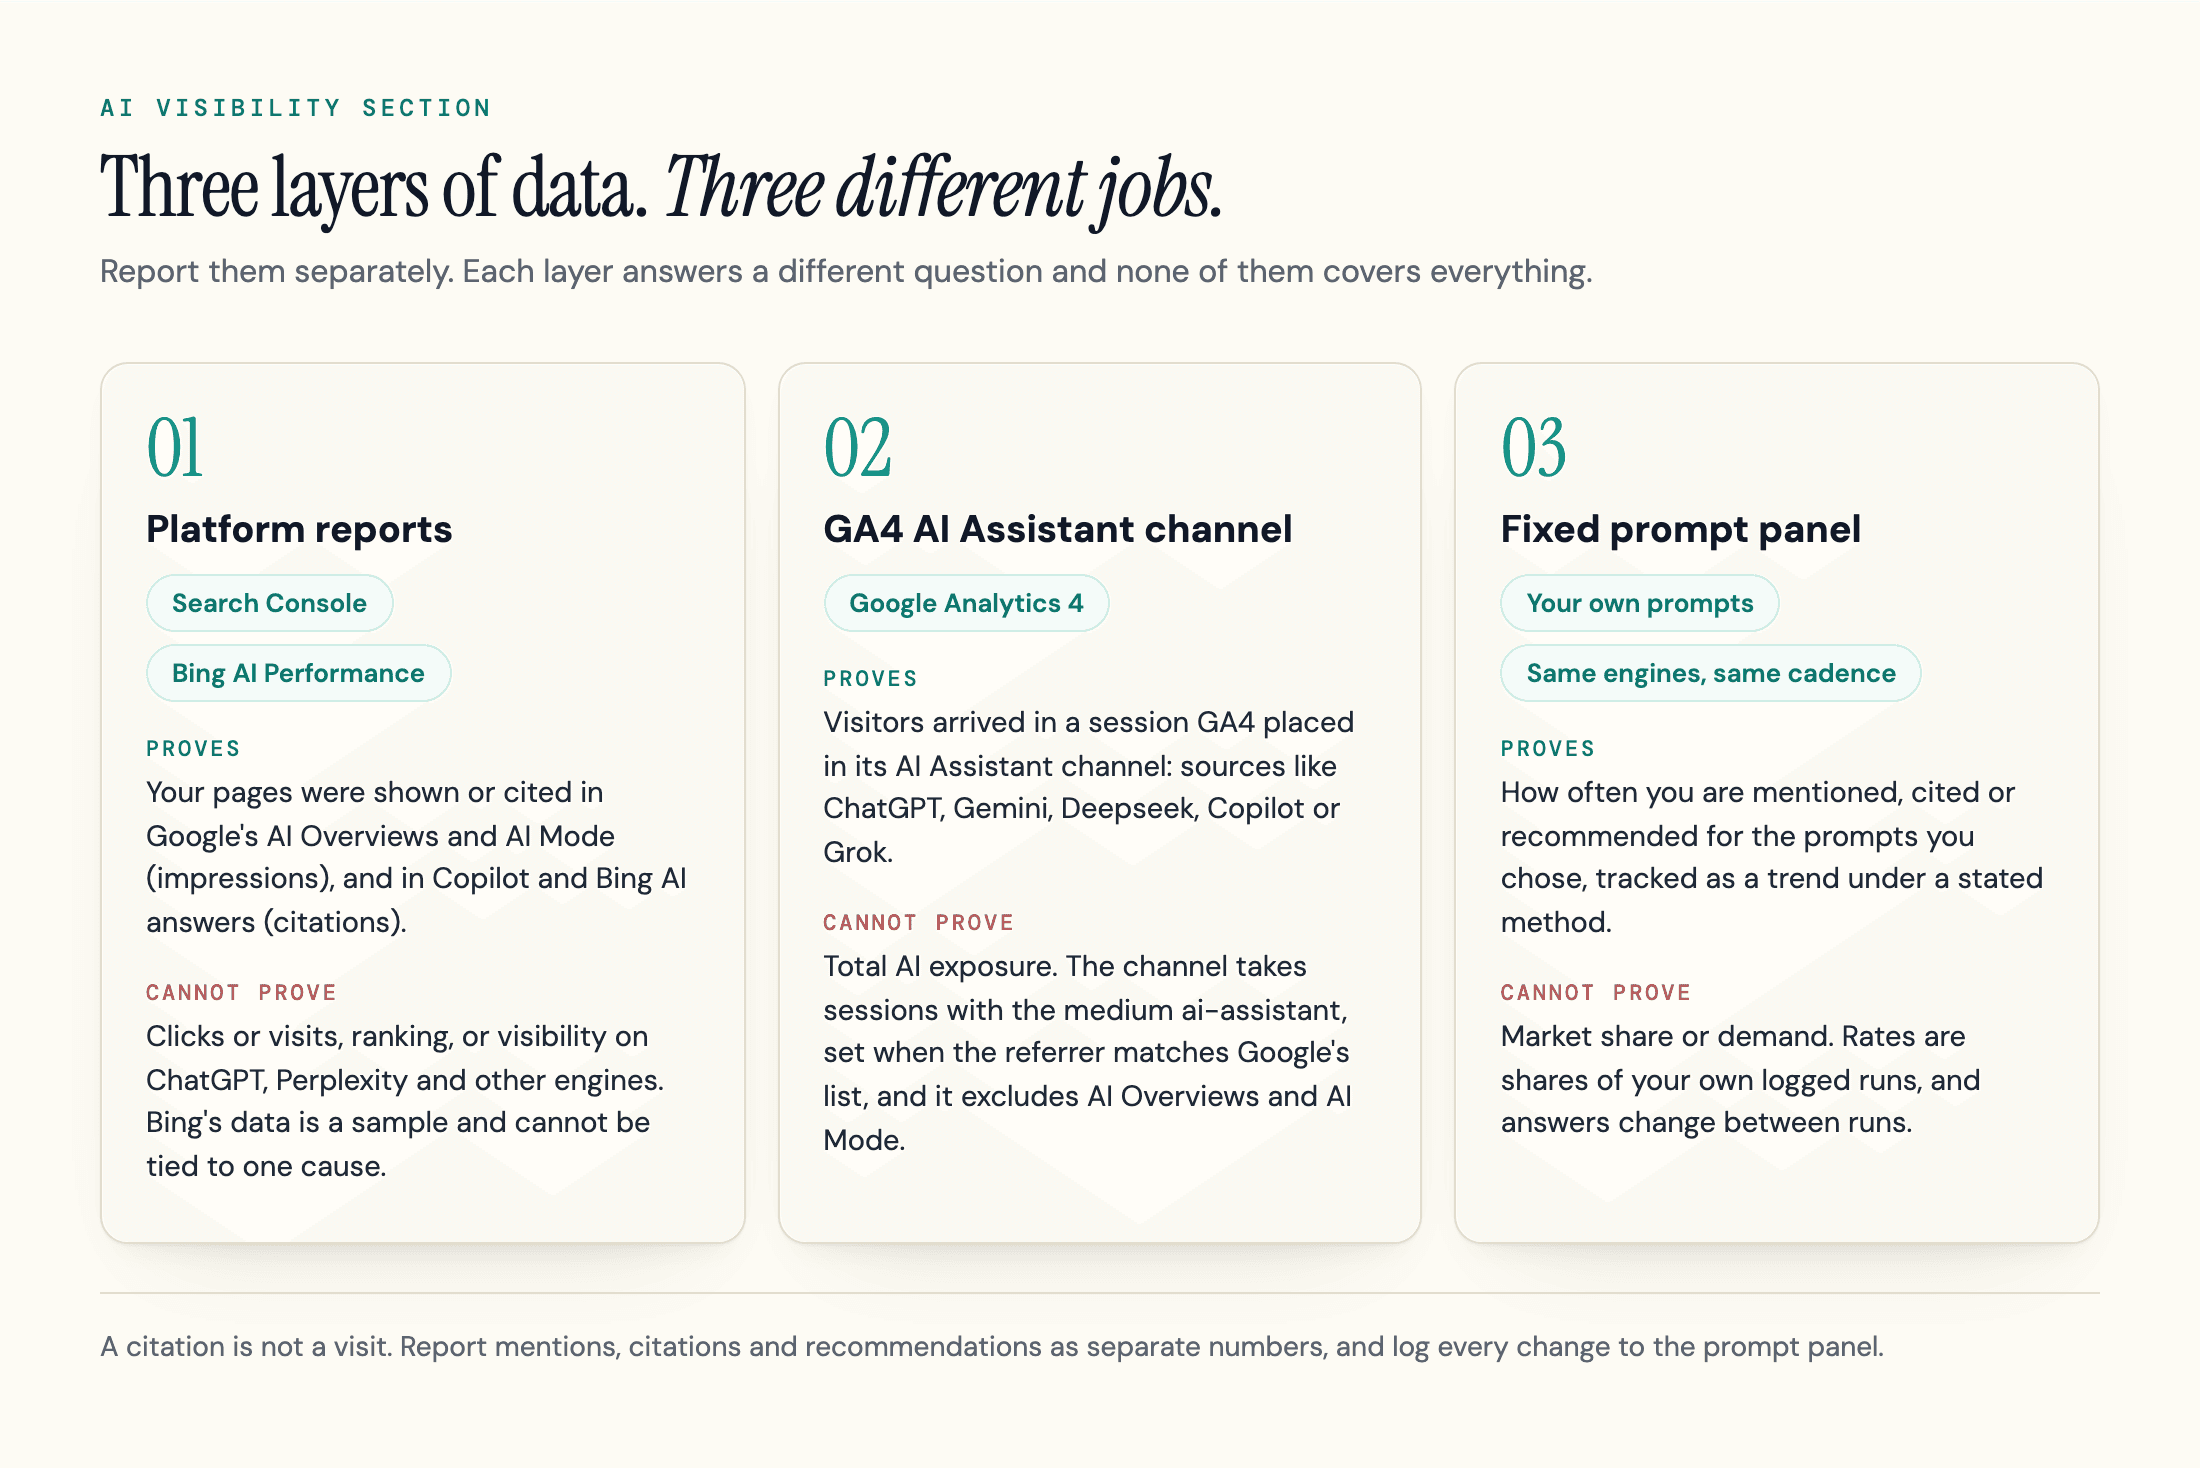
Report AI visibility as its own section, never folded into rankings, and build it from three layers that answer different questions. An AI visibility report shows how often your brand is mentioned, cited or recommended in AI-generated answers. The definitions and formulas live in our guides to what AI visibility is and AI search visibility metrics.
Layer 1: Platform Reports
Start with the free first-party data. Google's generative AI performance report for Search in Search Console covers AI Overviews and AI Mode, and Google says it reached all websites worldwide as of August 31, 2026. Google Discover has its own separate report.
The report groups data by page, country, device and date, and its data comes from the Web search type in the Performance report. The usual Performance report limits apply, including the 1,000-row limit on tables, so export the data each month and keep your own history. If you cannot see it, Google says the cause may be too few impressions in generative AI features, or that your site is excluded from them.
Google's documentation describes impressions only. Read the report as a visibility trend, not a traffic source, and note that queries are not among its listed dimensions. That is why it still does not replace an AI Overview tracker.
Bing has a first-party report for Microsoft's side, though it counts citations rather than impressions. AI Performance in Bing Webmaster Tools covers Microsoft Copilot, AI-generated summaries in Bing and select partner integrations. It shows total citations, average cited pages per day, grounding queries and page-level counts, viewable for 7 days, 30 days, 3 months or a custom range.
Bing states that the data is a sample of overall citation activity, and that trends cannot be attributed to a specific cause. It also says the report does not measure rankings, authority or importance. Microsoft has since added preview views for Intents, Topics, Citation Share and a period-over-period Compare view. Citation Share is your percentage of the citations shown for a grounding query, and Bing calls it an observational metric, not traffic share.
Layer 2: GA4's AI Assistant Channel
GA4 groups sessions from sources like ChatGPT, Gemini, Deepseek, Copilot and Grok into an AI Assistant channel. Google's channel definitions say a session lands in it when its medium is ai-assistant, which GA4 sets when the referrer matches Google's list of AI assistants, and that the channel excludes Google's AI Overviews and AI Mode.
Google introduces the list as sources like those named, so it is not exhaustive, and a visit that does not match lands in another channel. Treat the channel as a count of what GA4 can attribute, and note the date if Google's list changes. Perplexity is not among the sources Google names, so check where your own Perplexity visits land.
Layer 3: A Fixed Prompt Panel
Neither layer above shows what ChatGPT or Perplexity say about you. For that you need a panel: a fixed list of the questions your buyers ask, run on the same engines on a schedule, with the answers logged. A list of about 20 is a workable start. Run each prompt more than once, because the answer changes between runs (see how to measure your AI visibility).
The log on tab 5 of the spreadsheet holds up to 600 runs across months, and the sheet counts only rows with a 1 or 0 in all three outcome columns. Past a few dozen prompts, running and logging by hand stops being practical.
Then report these rates separately: mention (your brand is named), citation (your URL is shown as a source) and recommendation (you are named as a pick). They are different outcomes, and a brand can earn one without the others. Each rate is a share of your own logged runs, which is not market share.
Print the run count next to each rate, for example 7 of 10 runs, so the reader can see how little data sits under the percentage. The engine table on tab 5 shows this month's run count beside this month's rates, but tab 7 shows the citation rate alone, so carry the run count into your sentence.
Keep the panel stable: when you add or drop a prompt, write it in the change log and start a new trend line. If citations rise the month after a page update, you saw a correlation, not proof of cause.
| Metric | Where it comes from | What it proves | What it cannot prove |
|---|---|---|---|
| AI Overview and AI Mode impressions | Search Console, generative AI performance report | Your URLs were shown in Google's generative AI features | Clicks, or which queries triggered them (the documented report has neither) |
| Copilot and Bing AI citations | Bing Webmaster Tools, AI Performance | Pages were cited in Copilot, Bing AI summaries and select partner experiences | Rankings, authority, or the cause of a change (Bing also says the data is a sample) |
| AI Assistant sessions | GA4 default channel group | Visitors arrived in a session GA4 put in the AI Assistant channel | Total AI exposure; AI Overviews and AI Mode are excluded |
| Mention, citation and recommendation rates | Your prompt panel, manual or from a tracker | How often you appear for the prompts you chose, as a trend | Market share or demand, because answers vary between runs |
One check comes before any of it: can AI crawlers reach your pages at all? A report full of zeros means something different when a firewall is blocking the bots, and our AI visibility audit checklist covers that first.
Reconcile Search Console Clicks and GA4 Sessions Before Your Client Does
Expect clicks and sessions to disagree, print the definitions on the report, and compare trends instead of totals. Google's guide on using Search Console and Google Analytics together says clicks and sessions are calculated differently, so you will likely see different numbers. A small gap is normal and needs no fix. A big one deserves a look.
Google lists what it calls the most common causes of a big gap:
- Analytics tag problems, such as pages where the tag is missing
- Users who opt out of tracking
- Time zones: Search Console uses Pacific Time and cannot be changed, while GA4 lets you choose
- Attribution: Search Console counts every click, while GA4 applies an attribution model
- Canonical URLs: Search Console reports only the Google Search canonical URL
- Non-HTML files such as PDFs, which Search Console includes by default
- Bots: GA4 excludes known bots, and Search Console does not necessarily filter them
- Traffic breakdowns: Search Console splits traffic into web, image, video, news and Discover, and GA4 groups it differently
To compare like with like, run the comparison on GA4 sessions filtered to Session source = google and Session medium = organic, which is what Google's own dashboard template does. Keep the scorecard's sessions as the whole Organic Search channel, and footnote the scope: "Clicks: Search Console, Web search, Pacific Time. Sessions: GA4 Organic Search channel, all search engines."
Explain a Bad Month Without Making Excuses
Lead with the drop: how big it is, where it happened, which kind of cause it is, and what you will do. A report that buries a bad month makes the next good one less believable.
Sort the cause before you write the sentence. Four classes make a first sort:
| What you see | Likely cause class | Check first |
|---|---|---|
| Impressions and clicks both down across many queries | Demand or ranking | Compare year over year, then the rank tracker's fixed set |
| Impressions flat or up, clicks down | Click loss: a SERP feature or an answer took the click | CTR by page, and which pages now show an answer feature (see zero-click searches) |
| Search Console clicks steady, GA4 sessions down | Measurement | Tags, consent settings and time zones, using the list above |
| One page or folder drops, the rest holds | Page-level: a technical change or a lost link | Technical exceptions and index status for those URLs |
Then write it in a few plain lines. Written out:
Organic clicks fell from 480 to 440. Impressions held, but click-through fell on the five pages where an AI answer now appears. We are rewriting those answers and adding the pages to the prompt panel.
Watch the cause. Google documents its generative AI report as impressions only, so it cannot show which clicks an AI answer took. Say "consistent with" when that is all you have, and annotate the chart with the date the change began.
The One-Page Version and How Often to Send It
The executive version is five numbers, one risk and one decision. The numbers: organic sessions, organic key events, non-branded clicks, AI Assistant sessions, and your citation rate on the prompt panel. They come from the scorecard (section 2) and the AI section (9), so sections 3 to 8 stay in the full report. Under the numbers, one sentence on the biggest risk and one line on the decision you need from the reader. Tab 7 of the spreadsheet pulls the five numbers from the other tabs, so you write only the sentences.
If clients open the report mainly after a number has already dropped, agree two or three alert thresholds with them before the quarter starts and write them in the Target column of the scorecard. Name the window too, such as month to date against the same month last year, so a breach starts a conversation without waiting for the next report. A twelve-month chart beside the month also stops one weak month reading as a trend; the file has no such view, so build it in your dashboard.
Send the full report monthly. Organic results move over weeks, and a weekly report invites reactions to noise. Weekly updates make sense only around a migration or a launch, when something can break fast. Once a quarter, add a review of year-over-year trends, the tracked keyword set and the prompt panel. That cadence is a convention, so adjust it to how fast your client's decisions move.
When to Automate It or White-Label It
A spreadsheet is the right tool until copy-pasting becomes the job. The signs that your SEO reporting has outgrown it: the same numbers every month, errors creeping in, and more reports for clients than afternoons to build them. Automate the data pull at that point and keep the commentary human, because the commentary is the part clients read. Our AI SEO tools guide sorts the AI tools by job, if you are weighing which ones earn a place in the workflow.
For the AI section, geotoolbox's white-label reports send a monthly AI visibility report under your agency's logo, colors and footer, with a shareable link the client opens without logging in. It is on Growth plans and up. It reports AI visibility by engine, top prompts, competitor share of voice and AI Readiness, which is the AI section of this template, not the whole report. If you are choosing software for the white-label part, see our white-label reporting tools compared.
geotoolbox's Analytics view (in beta while Google completes its OAuth review) connects Search Console and GA4 to the app, but for the full classic report under a client's logo, Looker Studio or a general reporting tool will usually fit better.
Frequently Asked Questions
What should an SEO report include?
An executive summary, a KPI scorecard, organic traffic and conversions, brand and non-brand Search Console data, rankings, top landing pages, technical exceptions, backlinks, AI visibility and next steps.
How long should an SEO report be?
One page for the executive version. The monthly report should run as long as it takes to answer each section's question, with raw tables in an appendix. If a section does not change a decision, cut it.
How often should you send an SEO report?
Monthly for most clients, with a quarterly review that adds year-over-year trends. Weekly updates are worth sending only around a migration or a launch, when something can break quickly.
How do you make an SEO report?
Fix your definitions, pull last month and the month before from Search Console and GA4, and fill the scorecard. Add the brand split, top pages and AI visibility numbers, then finish with the executive summary and next steps.
What is an AI visibility report?
An AI visibility report shows how often a brand is mentioned, cited or recommended in AI-generated answers, plus the visits that arrive from AI assistants. It draws on platform reports, the GA4 AI Assistant channel and a fixed prompt panel, reported separately with the method stated.
Can ChatGPT build an SEO report or do an SEO audit?
It can help you structure a report and draft the commentary from numbers you give it. It does not have your Search Console, GA4 or crawl data unless you export it or connect a data source, so a report or an audit still needs real data from your own tools, and every figure it writes has to be checked against the original. Keep client data within what your agreement allows.
Where to Start
Fix your definitions first, then fill one month. In this order:
- Download the report template and fill the inputs on the Start Here tab: the reporting month, your brand terms, the GA4 key events that count, and the date range
- Fill tabs 1 to 4 from Search Console, GA4 and your rank tracker for last month, then enter the month before so the KPIs and their changes calculate
- Open the generative AI performance report, check the GA4 AI Assistant channel, and log your first prompts on tab 5
- Write the executive summary and the next-steps table last
If this is your first AI visibility report, run geotoolbox's free AI Readiness checker first: it tests robots.txt, AI-crawler access, content signals, sitemap and markdown in one pass, with no sign-up.
Sources
- Generative AI performance report (Search) - Google Search Console Help -
support.google.com/webmasters/answer/16984139 - [GA4] Default channel group - Google Analytics Help -
support.google.com/analytics/answer/9756891 - AI Performance in Bing Webmaster Tools - Microsoft Bing Webmaster Tools Help -
bing.com/webmasters/help/ai-performance-9f8e7d6c - New AI Visibility Insights in Bing Webmaster Tools: Intents, Topics, Citation Share, Compare - Microsoft Bing Blog, June 2026 -
blogs.bing.com/search/June-2026/New-AI-Visibility-Insights-in-Bing-Webmaster-Tools-Intents-Topics-Citation-Share-Compare - Using Search Console and Google Analytics data for SEO - Google Search Central -
developers.google.com/search/docs/monitor-debug/google-analytics-search-console - What are impressions, position, and clicks? - Search Console Help -
support.google.com/webmasters/answer/7042828